| This article is part of our series on Ride-Sharing App Cost in the USA: Full Breakdown, MVP to Enterprise. |
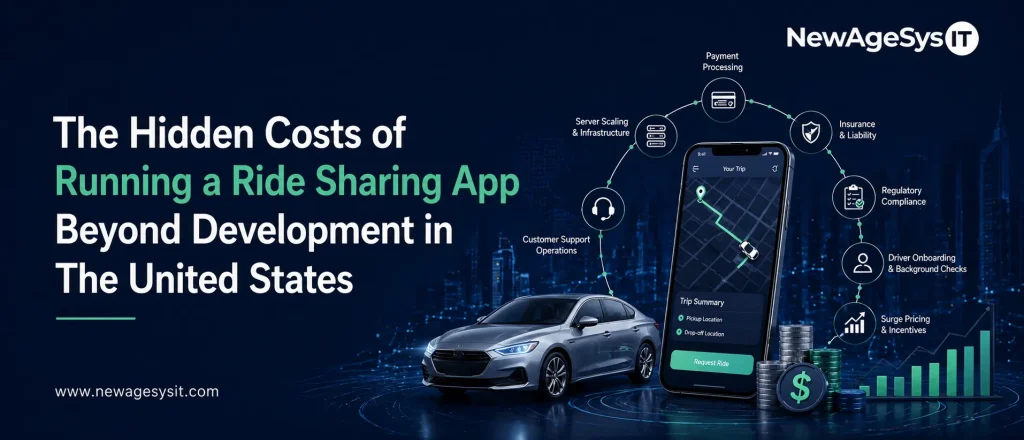
Most founders assume the biggest financial hurdle in a ride-sharing app running costs journey is building the product itself. In reality, development usually accounts for only 40 to 60 percent of the total first-year spend. The rest comes after launch, driven by ongoing infrastructure scaling, third-party APIs, compliance, insurance, support, and continuous engineering.
Budgets typically start to strain once the platform gains traction. Many ride-sharing apps run smoothly early on but face a funding gap within 6–9 months as scaling costs, API fees, and compliance demands increase together.
At that point, the focus shifts from building the platform to sustaining it. That’s where areas like ride-sharing web application development, custom ride-sharing software development, and ride-sharing mobile app development extend beyond launch into long-term operational commitments.
This article maps the full operational cost picture, focusing on post-launch costs, and determines whether a ride-sharing platform survives its first year of operation.
Mapping and Location API Costs
Mapping services are one of the most usage-sensitive components and a major part of ride-sharing app third-party API costs. Every ride triggers multiple API calls: route generation, driver matching, distance calculation, and live navigation updates. This makes costs scale directly with trip volume rather than remaining fixed:
- Google Maps Platform pricing (2026) includes Maps Static API at $2 per 1,000 requests, Directions API at $5 per 1,000, Places API between $17 and $32 per 1,000 requests, and Distance Matrix API at $5 per 1,000 elements.
- Monthly estimates include $300–$800 for 500 riders, $2,000–$5,000 for 5,000 riders, and $15,000–$40,000 for 50,000 riders.
- Mapbox alternative offers 50,000 free map loads per month and is widely adopted at around 10,000 monthly active users, where it can reduce Google Maps costs by 30 to 50 percent for mid-scale ride-sharing platforms.
- HERE Technologies, another alternative, is used at an enterprise scale for fleet and mobility-focused platforms, offering flexible pricing and advanced routing capabilities.
This structure is directly influenced by platform architecture decisions. It is made during ride-sharing web application development, along with mobile-side implementation in ride-sharing mobile app development.
These API-driven costs are just one part of the overall cost structure. For a broader understanding, see the full ride-sharing app development cost framework.
SMS, Verification, and Communication API Costs
Communication services add a recurring layer to rideshare app operational costs. This is because nearly every user action, such as signup, login, ride confirmation, or payment update, relies on OTPs and real-time notifications. Unlike infrastructure costs, these expenses scale directly with user interactions, making them highly sensitive to platform growth and engagement levels. For example:
- Twilio SMS pricing (2026) is around $0.0079 per SMS in the US, with phone number rental at $1 per month. OTP verification via Twilio Verify costs about $0.05 per successful verification.
- Estimated monthly costs scale as follows: $200–$600 for 1,000 users, $1,500–$4,000 for 10,000 users, and $10,000–$30,000 for 100,000 users.
- There are some alternatives like MessageBird (Bird), Vonage, and AWS SNS, with AWS SNS offering lower-cost, high-volume one-way messaging but fewer advanced communication features.
- Push notifications via Firebase Cloud Messaging (FCM) are free at all volumes, making in-app push the preferred channel for status updates wherever possible to reduce SMS usage.
Payment Processing Fees
Payment processing is a core operational layer in any ride-sharing platform. Every completed trip moves through gateways, payout systems, and verification flows that take a fixed percentage at each step. While the cost per transaction looks small, it scales directly with ride volume and becomes a meaningful margin factor as the platform grows. For instance:
- Stripe standard pricing is 2.9% + $0.30 per successful card transaction, while Stripe Connect adds 0.25% + $0.25 per transfer for instant driver payouts. Standard ACH payouts are free but take 1–3 business days.
- At scale, estimated monthly costs are around $320–$380 at $10,000 GMV, $3,200–$3,800 at $100,000 GMV, and $32,000–$38,000 at $1,000,000 GMV.
- Once processing volumes cross $250,000 per month, platforms often negotiate lower rates, typically around 2.2% + $0.25 at higher tiers like $500,000 monthly volume.
- Alternatives such as Braintree (PayPal) are also used, depending on pricing structure and dispute-handling preferences.
Driver Background Check and Verification Costs
Driver onboarding adds a recurring compliance cost layer, as every new driver must pass identity and background screening before activation. Unlike setup costs, this scales directly with driver acquisition and turnover, making it a continuous operational expense in ride-sharing platforms.
Checkr is widely used in the US, with background checks costing $25–$65 per driver. This depends on coverage (motor vehicle, criminal, and registry checks), with most platforms operating in the $35–$55 range.
At scale, this equals $3,500–$5,500 for 100 drivers and $17,500–$27,500 for 500 drivers. Document verification APIs like Persona, Stripe Identity, and Jumio cost $0.50–$3.00 per check for license and insurance validation. Most US markets also require annual re-verification, making this a recurring cost as well, tied to active drivers.
Important Note: Background check and verification rules vary by US state. This information is for planning purposes only. Always consult legal and compliance experts for market-specific requirements.
Cloud Infrastructure and Maintenance Costs
Cloud infrastructure is another important factor of any ride-sharing platform. Its cost scales directly with user activity, data processing, and real-time operations. Unlike a one-time development effort, this becomes a continuously growing expense as the platform moves from early traction to large-scale operations.
- Early stage (0–1,000 monthly active riders): AWS or Google Cloud typically costs $500–$2,000/month, covering core services like API hosting (EC2 or Cloud Run), PostgreSQL databases, Redis caching, and S3 storage.
- Growth stage (1,000–10,000 riders): Costs increase to $2,000–$8,000/month as systems require load balancing, auto-scaling, read replicas, and CDN integration.
- Scale stage (10,000–100,000 riders): Infrastructure expands to $8,000–$35,000/month with multi-region deployment, database sharding, and dedicated DevOps support.
- Maintenance costs: Ongoing updates, bug fixes, and system improvements typically require 0.5–1.5 FTE engineering effort, or $3,000–$8,000/month with offshore teams.
For a detailed comparison of ongoing development and maintenance team costs, see “In-House vs Outsourced Ride Share Development: Cost Comparison by Region.”
Insurance and Compliance Ongoing Costs
Insurance and compliance costs scale steadily in ride-sharing platforms because they are driven by regulation, risk, and ride volume rather than fixed infrastructure. As operations expand across states, these become a permanent part of unit economics.
TNC commercial insurance typically ranges from $0.10–$0.25 per mile when coverage is handled by the platform, making every trip a direct cost input. Annual state TNC license renewals range from $1,000 to $15,000, depending on jurisdiction.
Legal and regulatory monitoring adds about $12,000–$40,000 per year for multi-state operations. Data privacy compliance (including CCPA requirements) contributes another $5,000–$15,000 annually for audits and data handling. Customer support also sits in this layer, costing $8–$18 per ticket, with hundreds of tickets processed monthly at mid-scale.
Important Note: Insurance and compliance requirements vary by US state and should be validated with qualified legal and insurance experts.
Conclusion
The operational cost of running a ride-sharing platform in the US often exceeds development spend within the first year due to scaling infrastructure, APIs, compliance, insurance, and support. Platforms that only budget for build cost often face funding pressure as real usage grows.
Founders who map the full operational cost structure before launch are better positioned to avoid mid-growth funding gaps and maintain stability during early scale.
If your team is planning the financial model for a US ride-sharing platform, working with a trusted ride-sharing partner can lead to a more accurate and defensible financial plan. This way, you can conveniently build a complete operational cost stack, including APIs, infrastructure, verification, compliance, and support, before investor discussions.